The problem: dashboards show what happened, decisions need what's next
Most teams already have reports. They show last month's sales, this week's tickets and the accounts that churned. The decisions those teams make, such as what to stock, which account to call or which lead to prioritise, depend on what is likely to happen next, and that part still runs on memory and instinct.
A model nobody acts on is a cost.
Predictive analytics turns historical and live business data into forecasts, scores, ranked options and next-best actions. The value is not the prediction itself. It is a reviewable signal that appears in the dashboard, alert, API or workflow where someone can act on it, early enough to matter.
That is also where most projects go wrong. A model nobody acts on is a cost. A score presented as a probability without calibration misleads. A forecast without uncertainty invites false confidence. The work starts with the decision, the action owner, the baseline the model has to beat and the feedback that will show whether the signal helped.
How to decide, including when not to build
Use standard BI or a simple rule when it answers the decision reliably. A predictive system is useful when you need a tested model or ranking pipeline integrated into the workflow. For the comparison in depth, read predictive analytics vs BI.
Build when
- A recurring decision, such as replenishment, account prioritisation, intervention or ranking, would improve with an earlier or sharper signal.
- There is enough dated history and enough relevant outcomes to evaluate a model on data it has not seen.
- Someone owns the action and will see the signal where they already work.
- Outcomes can be captured afterwards, so the system can learn whether the signal helped.
Don't build when
- A dashboard or a fixed rule already answers the decision well enough.
- The history cannot support a credible evaluation. We review the data first and stop if it cannot.
- Nobody will change what they do based on the signal.
- You need a causal explanation. A model shows likely patterns, not why they happen or what an intervention will cause.
- The data cannot be refreshed often enough for the decision's planning horizon.
Options, simplest first
Simple baselines and task-specific models
Compare seasonal, statistical, rules-based and supervised approaches before selecting a more complex model.
Forecasting foundation models
Evaluate these as candidates when the history and horizon fit. Check licensing, commercial access, cost and task performance; they do not replace evaluation.
Recommendation and ranking pipelines
Separate candidate generation from scoring and reranking, so relevance, coverage and business constraints can be tested on their own.
LLMs for explanation
Generate a readable explanation from computed results and permitted context. A language model should not invent the forecast, the confidence or a causal story.
Reference architecture for a decision-first predictive system
Whether the output is a forecast, a score or a ranked list, the same stages apply. The order below follows a signal from the decision it serves to the feedback that improves it.
- 01Decision definition
- 02Data audit and preparation
- 03Baseline
- 04Model or ranking pipeline
- 05Evaluation on unseen data
- 06Delivery into the workflow
- 07Explanation layer
- 08Feedback and drift
Decision definition
The target, the planning horizon, the action owner and what they will do differently. This fixes what "accurate enough" means.
Data audit and preparation
Dated history is cleaned and merged on a schedule that can be re-run for any past day, with checks for leakage: information the model would not have had at decision time.
Baseline
A simple seasonal, statistical or rules-based method the model must beat. Without one, there is no way to tell whether the model adds value.
Model or ranking pipeline
A task-specific model, a foundation-model candidate, or a candidate-generation, scoring and reranking pipeline with availability and policy filters.
Evaluation on unseen data
Time-ordered holdouts, error by segment and horizon, ranking relevance and coverage, and calibration tests whenever a probability is shown.
Delivery into the workflow
The signal appears in the dashboard, alert, API or tool where the owner works, with the uncertainty and the drivers behind it visible.
Explanation layer
Where it helps, a language model turns computed results into plain-English explanations and recommended next steps, without changing the numbers.
Feedback and drift
Outcomes and user labels are stored; quality is monitored against a threshold; the model is retrained, adjusted or routed back to the baseline rule when it slips.
Quellix calls this the Signal-to-Action Model: every prediction or recommendation is tied to a business decision, a visible confidence pattern and a feedback loop, so teams can learn whether the signal is helping.
Common failure modes
Predictive systems fail by looking more certain than they are. Most of these failures can be caught in evaluation if you look for them.
Leakage
A feature quietly contains the answer, such as a status set after the outcome. Offline scores look excellent and production results do not. Check what was known at decision time.
Random splits on time-ordered data
Shuffling dates into training and test sets lets the model see the future. Use time-ordered holdouts.
A score presented as a probability
A weighted health score is not a calibrated churn probability. Show probabilities only when calibration has been tested.
Forecasts without uncertainty
A single number invites false confidence. Show error by segment and horizon next to the forecast.
Seasonality read as risk
Quiet periods that are normal for the business trigger false alarms. Compare activity to the right seasonal reference, such as filing windows or prior seasons.
Offline relevance claimed as business lift
Good ranking metrics do not establish conversion lift. Measure the operating result separately.
Unmonitored drift
Demand, customers or products change and the model keeps predicting the past. Track quality continuously and alert below a threshold.
An invented causal story
An explanation layer that writes why something will happen, beyond what the model computed. Keep explanations grounded in the computed drivers.
Cost and effort drivers
Predictive work is mostly data work and integration work. These factors move the scope most.
Data cleanup and merging
Lower effortClean, dated history in one systemHigher effortInconsistent data spread across systemsInconsistent codes, missing dates and data split across systems usually take the first stretch of effort, before any model is trained.
Granularity
Lower effortOne national monthly numberHigher effortPer SKU, region and weekA forecast per SKU, region and week is far more work than one national monthly number: more series, more sparse data and more evaluation.
Number of decisions and segments
Lower effortOne decision, one segmentHigher effortSeveral decisions, mixed segmentsEach decision needs its own target, baseline and evaluation. Segments with different behaviour may need separate treatment.
External signals
Lower effortInternal data onlyHigher effortFestival, weather or market dataFestivals, weather or market data can improve a forecast and add sourcing, licensing and refresh work.
Refresh cadence and integration
Lower effortNightly batch into a dashboardHigher effortReal-time scores inside a CRM or productA nightly batch into a dashboard is simpler than real-time scores inside a CRM or product, which need APIs, latency budgets and monitoring.
Feedback capture
Lower effortOutcomes already recordedHigher effortNew labels added to the workflowRecording outcomes and user labels, such as "accurate", "false alarm" or "saved", needs workflow changes, and is what lets the system improve.
Quellix scopes this work in three steps: a free AI Fit Review of the decision and the data, a focused working POC for qualified opportunities, then production delivery against agreed milestones and acceptance criteria. See how we work and pricing.
Service and case studies
ServicePredictive Analytics & Recommendation SystemsHow Quellix scopes, builds and hands over this kind of system.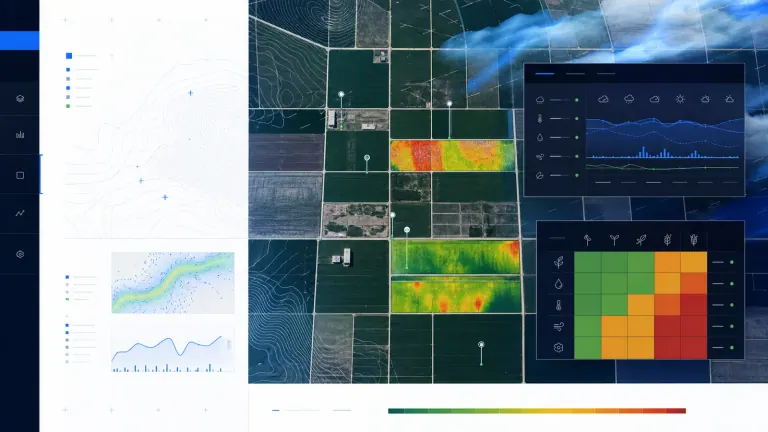 Case studyAI-driven forecasting for Madan Mohan GradingsNightly SKU, region and week forecasts, distributor ranking and region-level expansion signals ready before the morning meeting, with drift monitoring.
 Case studyCustomer health and churn risk for accounting SaaSWeighted health and churn risk scores with explainable drivers, seasonality-aware logic and CSM feedback labels for later models.
The FMCG case shows a planning workflow; displayed mockup metrics are illustrative. The accounting SaaS case describes weighted health and risk scores with feedback for later churn models, not calibrated churn probabilities or proven churn reduction.
Start here
The articles below go deeper on the parts of this guide that teams ask about most, in a sensible reading order.
- Predictive Analytics vs BI: Choosing the Right BuildChoosing BI, predictive analytics or both for forecasts, renewal risk and scoring.
- AI Demand Forecasting for Inventory DecisionsTurning sales and inventory signals into reviewed stock and capacity decisions.
- Retail Predictive Analytics for Inventory DecisionsRetail demand and customer signals behind governed inventory decisions.
- Predictive Lead Scoring That Sales Teams TrustLead scores and next-best actions that reps can inspect and challenge.
- Personalization Engine for Ranked RecommendationsAn implementation path for ranked recommendations and offers.
- Decision-First AI Fraud ScoringReviewable fraud predictions, risk queues and lower customer friction.
- Claude Sonnet 5.5 and the Forecast Review WorkflowTesting a language model in forecast review, separately from forecast accuracy.
Every Predictive Analytics & Recommendations article
All 7 published field notes in this cluster, newest first.
 Claude Sonnet 5.5 and the Forecast Review Workflow
Sonnet 5.5 offers a new forecast-review candidate. Test evidence, historical context, and planner approval separately from forecast accuracy.
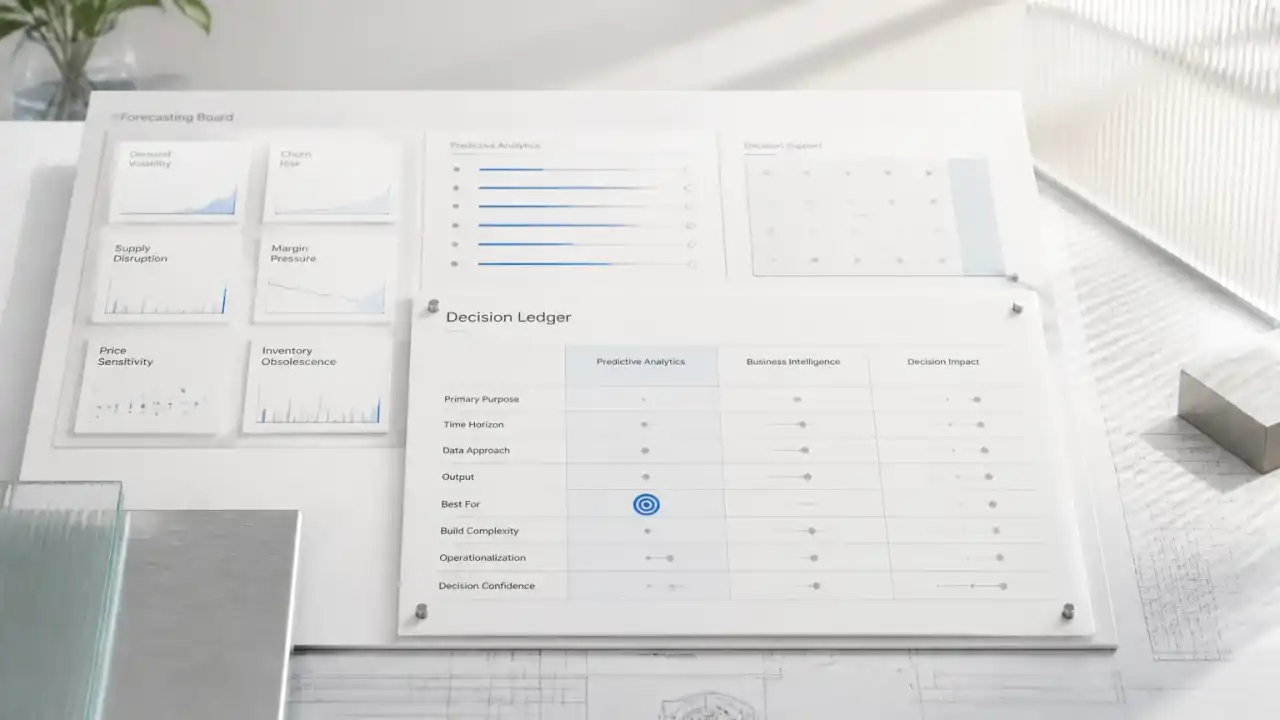 Predictive Analytics vs BI: Choosing the Right Build
A buyer's guide to choosing BI, predictive analytics, or both for forecasts, renewal risk, lead scoring, and operational decisions.
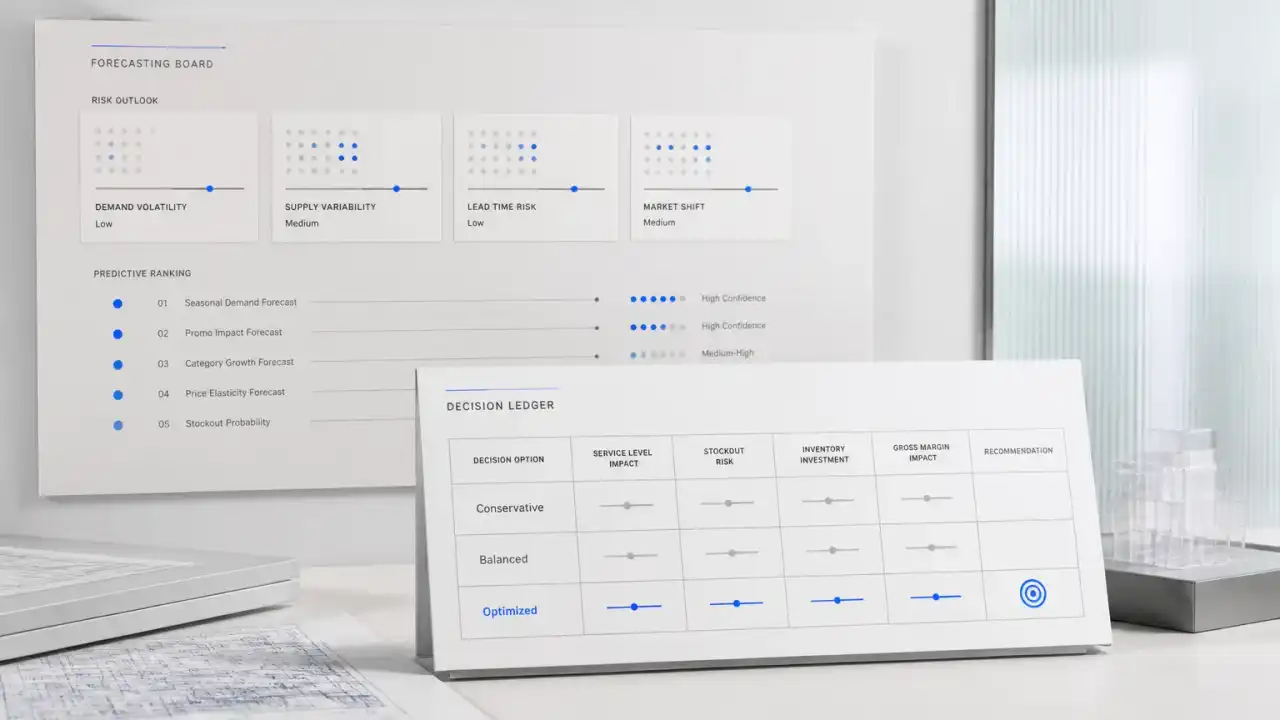 Retail Predictive Analytics for Inventory Decisions
Retail predictive analytics turns demand, inventory, and customer signals into governed inventory decisions that teams can act on sooner.
 AI Demand Forecasting for Inventory Decisions
AI demand forecasting turns fragmented sales and inventory signals into reviewed decisions about stock, capacity, and commercial risk.
 Personalization Engine for Ranked Recommendations
A personalization engine implementation path for turning B2B customer signals into governed rankings, offers, and next-best actions.
 Predictive Lead Scoring That Sales Teams Trust
Turn sales signals into lead scores and next-best actions your reps can inspect, challenge, and use.
 Decision-First AI Fraud Scoring
Modernize fraud scoring with reviewable predictions, risk queues, and controls that reduce customer friction.
Browse by category: Predictive Analytics & Recommendations
Have a decision that still runs on instinct?
Bring the decision, the data you have and who acts on it. An engineer will check whether a model can beat your current baseline before anything is built.